One place to run the program.
Keep available spaces, sponsor requests, approvals, contracts and renewal dates together. Give school and district teams a consistent process with clear oversight.
Vivid for Schools & Organizations
Manage school and district sponsorships from available space to renewal. Bring inventory, sponsor requests, approvals, contracts, revenue and placement-level performance into one shared workflow.
Built for organizations that sell advertising and sponsorship opportunities across one or many locations.
Built around school sponsorships
Make it easier for local businesses to support your school—and for your team to manage every placement, agreement and renewal.
Keep available spaces, sponsor requests, approvals, contracts and renewal dates together. Give school and district teams a consistent process with clear oversight.
Showcase approved opportunities across car-line fences, stadiums, gyms, campus spaces and publications. See what is available, what is sold and where sponsorship revenue can grow.
Connect each physical placement to its QR engagement and campaign activity. Bring placement-level results into sponsor conversations, with conversions and revenue where tracking is configured.
Transparency that protects revenue
Vivid gives the organization and advertiser a credible record of activity and results. Teams can address weak performance before expiration, prove successful investments and enter renewal conversations with evidence—not anecdotes.
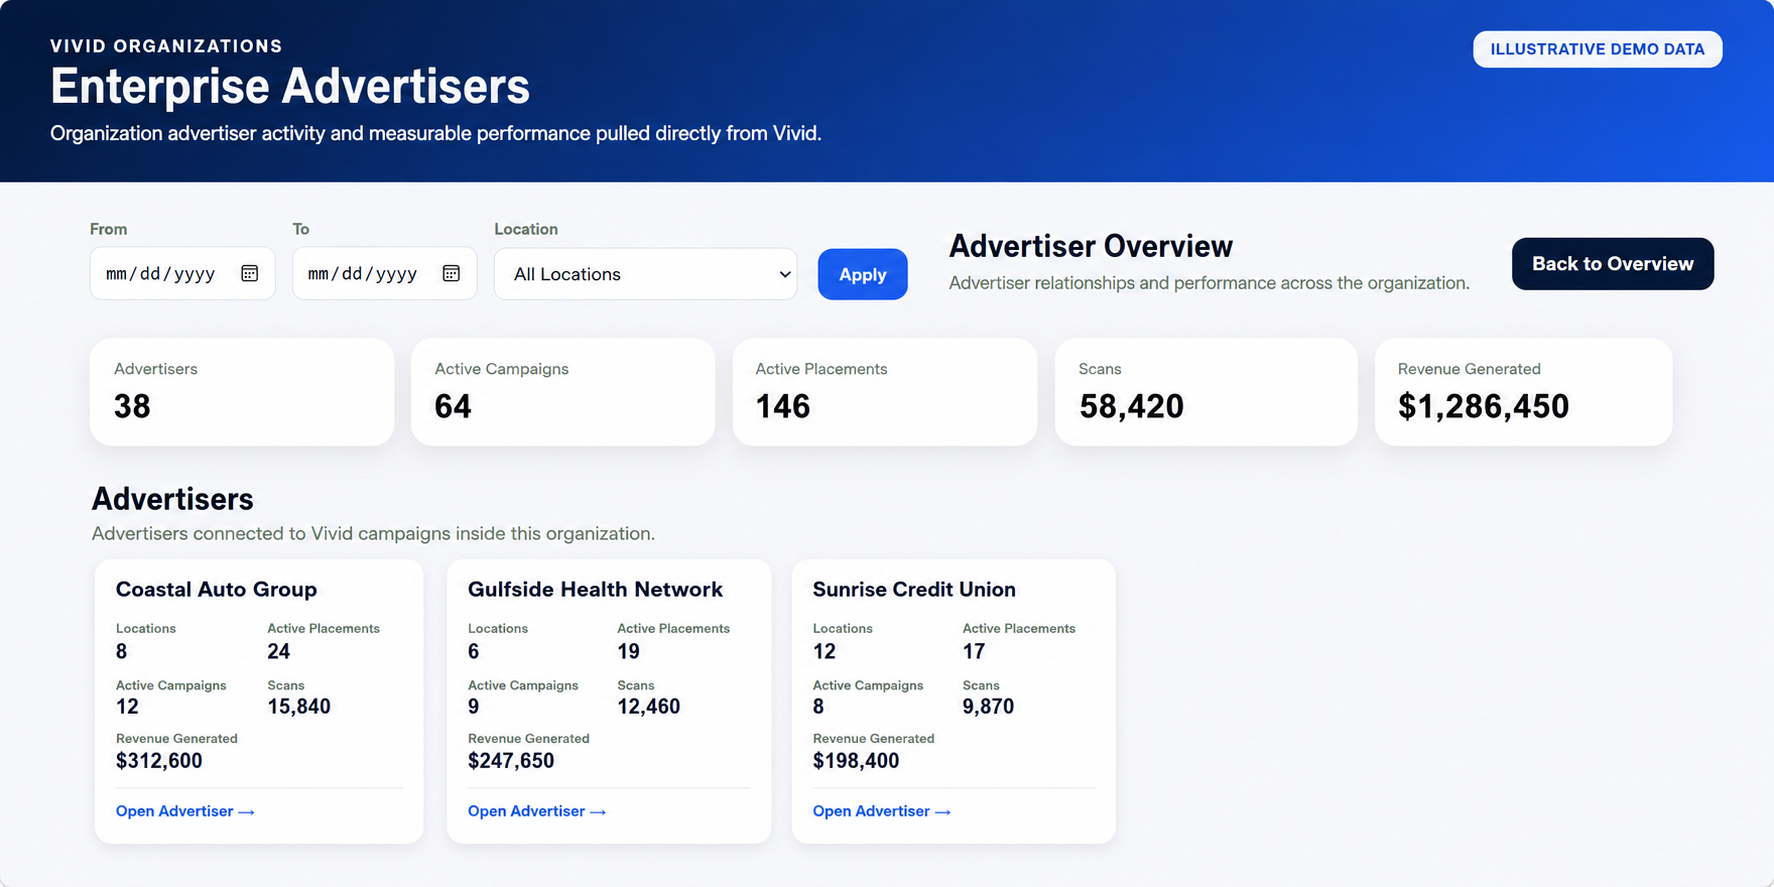
One organization-wide source of truth
Vivid connects the work and data that normally live across departments, locations and disconnected tools—so leaders see the complete outcome and every team can act from the same information.
Know what can be sold, where it is located, what it costs and whether it is available.
Keep every customer, contact, conversation and opportunity connected to the organization.
Connect terms, dates, spots, creative, schedules and activity without separate tracking files.
See what every advertiser, location, spot and campaign is producing.
Use real activity and results to protect revenue, improve offers and identify expansion opportunities.
Why Vivid is different
Other systems stop at the relationship, fulfillment or interaction. Vivid connects the complete commercial outcome.
Value by discipline
Vivid removes organizational silos without forcing every user into the same view.
See total inventory, active revenue, performance, upcoming renewals and revenue at risk across the organization.
Know what is available, who owns each account, what happens next and where renewal or upsell opportunities exist.
Centralize pricing, contracts, approvals, schedules, reporting and revenue accountability across locations.
Give local teams the exact inventory, advertiser and campaign view they need—without losing enterprise control.
Provide transparent reporting by location, spot and campaign so customers can understand value and make better decisions.
Vivid in the field
Vivid adapts the same connected campaign, location and performance framework to the job each organization needs to accomplish.
A global manufacturer is using Vivid to track trade-show activity and extend the same analytics framework into customer-service and quality-control workflows.
A marketing agency has deployed Vivid for a client’s driver-recruiting campaign across its truck fleet, directing candidates to the company’s HR page while managing the campaign centrally.
Use cases describe active applications of Vivid. Customer identities are withheld, and no performance outcomes are implied where results have not yet been established.
Operating in Vivid today
Vivid combines revenue management, operating workflow and measurable advertiser performance inside one connected platform.
Explore the platformModel the opportunity
Model potential new revenue, improved advertiser retention and administrative savings across your locations.
Model new advertising revenue, optional recurring advertiser-service revenue, renewal retention and operating efficiency.
Illustrative estimate only. Results depend on inventory, pricing, advertiser demand, adoption and execution. This calculator does not guarantee financial results.
Explore the upgraded platform
See what brings people in, what produces revenue, and what to do next. Try the cards below to follow the results.
Read the $3,000 marketing exampleYour marketing, together.
Website traffic, connected channels and measurable outcomes.Explore the details: Click the button at the bottom of any card to drill into its results. Website and social cards reveal example traffic URLs, posts and topics. Use “Inspect evidence” to see what supports a recommendation.
Showing illustrative results for September 1–28, 2026
10% off offer · $1,200 spend
Free appetizer · $1,200 spend
Awareness campaign · $600 spend
Organic video performance
Why: Meta reported 90 purchases and $4,500 in value. Google reported 18 conversions and $900 on the same spend.
Next: Test the offer with comparable targeting. Compare purchases, revenue and cost per purchase before shifting budget.
Why: 8 leads cost $600—$75 per lead. No sales value is recorded, so the revenue outcome is still unknown.
Next: Match those leads to closed sales before increasing or reducing the LinkedIn budget.
Illustrative demo, not live customer results. The shorter period shows a simplified sample subset. GA4 and ad-platform revenue may overlap; do not add them together. Available metrics depend on account permissions and tracking. Recommendations do not automatically change spend.
Your 15-minute Advertising Revenue Assessment
We’ll map your current workflow and identify where inventory is underused, customer activity is fragmented, renewal visibility is weak and Vivid could connect the operation.